We make bikes and performance solutions that deliver measurable athlete performance improvements.
At Kú Cycle we don’t believe it is enough to put a sponsored Pro on a Kú TF1 in the wind tunnel for a few hours and then make some very generalised claims about it’s performance.
In order to truly validate the Kú TF1s unique approach to aerodynamics, which requires each rider to be specifically sized to their TF1, we need to demonstrate across a wide range of athletes and conditions that we make good on our promise to deliver measurable athlete performance improvements.
To do this we created the Kú Aero Camp concept.
We would take multiple athletes, with different abilities and backgrounds and, over several days, test them on the Kú TF1.
In many cases these tests were done in direct competition against the athlete’s current triathlon bike.
Each four day camp starts with a bike familiarisation, baseline data setting to then move inside to the velodrome for two days of detailed position and equipment testing. The camp closes with a final day out on the dyke in real race conditions.
Please read below all the details about the Kú Aero Camp.
KÚ AERO CAMP LOCATIONS
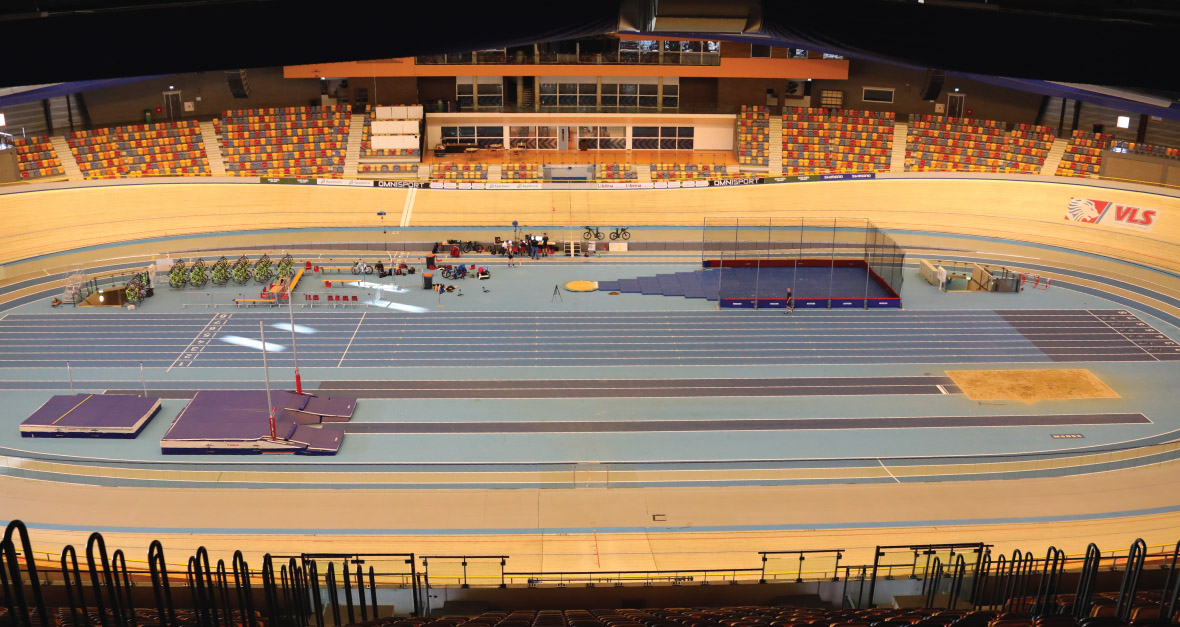
APELDOORN, THE NEDERLANDS The Velodrome Omnisport Arena
Home to the Dutch National Squad the Kú Cycle team took over the Omnisport Arena in Appeldoorn for the indoor phase of each weeks test program.
ALMERE, THE NEDERLANDS Ijmeerdijk Dyke
Kú Cycle have made the dyke at Almere their own private test track for outdoor testing. This location offers the perfect combination of surface, flatness and wind for studying the real effects of conditions on aero performance.
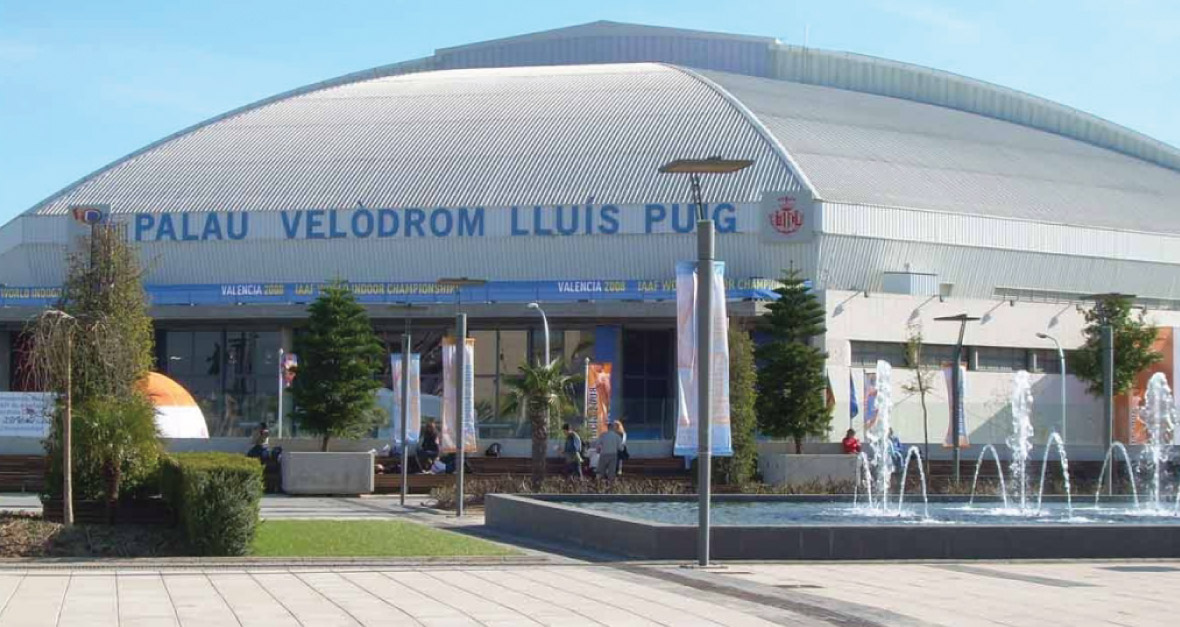
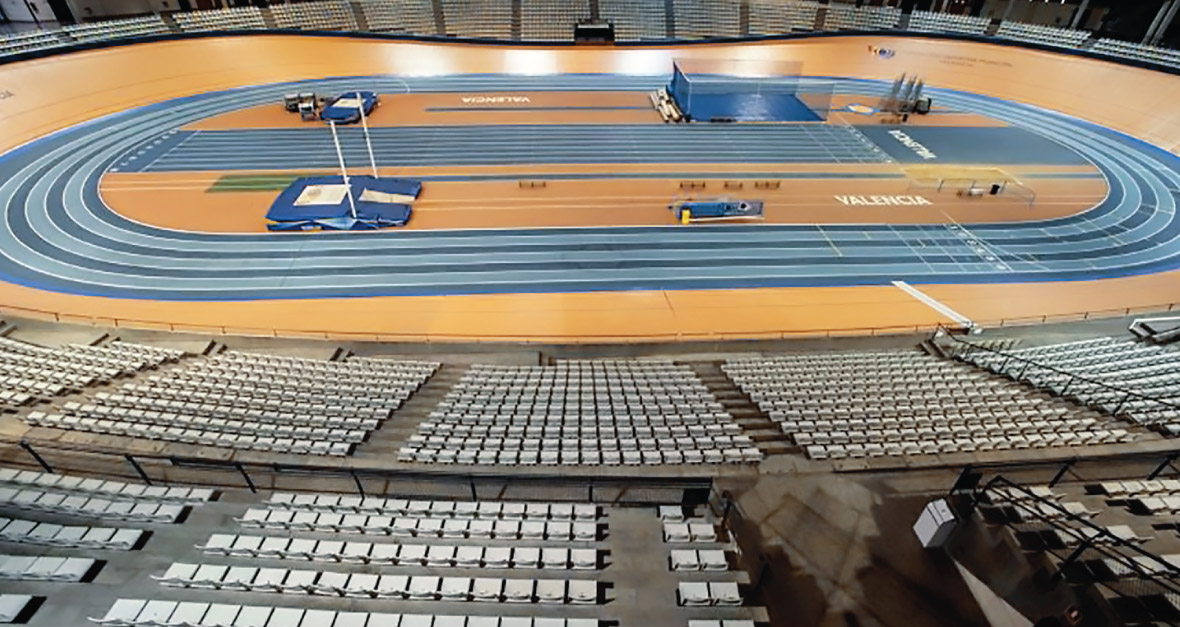
VALENCIA, SPAIN The Velodrome Luis Puig Palace Valencia.
Anyone familiar with our HQ location in Almere in the Netherlands will know the weather cannot always be very friendly for testing, this is especially the case when we head into late autumn! So on the the 17th 18th and 19th of November 2021 Kú Cycle together with our fitter partners from Spain, Italy and the UK travelled to Valencia in Spain for the first Kú Cycle Performance Camp.
VALENCIA, SPAIN Outdoor Velodrome La Pobla de Vallbona.
KÚ AERO CAMPS
Our four spring 2022 Kú aero camps saw 24 athletes, 8 female and 16 male, representing 8 different nationalities
The athlete spend four days of concentrated testing on their own Kú TF1 tuning their fit and achieving their most efficient aero set up for the summer race season ahead.
‘In god we trust. Everybody else, bring data’ (W. Edwards Demming)
During a Kú Aero camp each rider completes anywhere between 35km to 60km in
data collection test runs. For Kú Cycle this means an average of 300km of accumulated aero data collection from each Aero camp.
With each of our AeroLab devices collecting 5000 data points every second at a 40km/hr average that’s around 22 million data points per athlete, or 135 million data points for each four day Aero camp.
For each rider a complete data set to describe the test conditions and the tests performed is recorded.
“Testing is a comparison based iterative procedure that proceeds against known reference points until a desired outcome is achieved”
For each test and each rider the reference points are the test runs already completed in the same conditions.
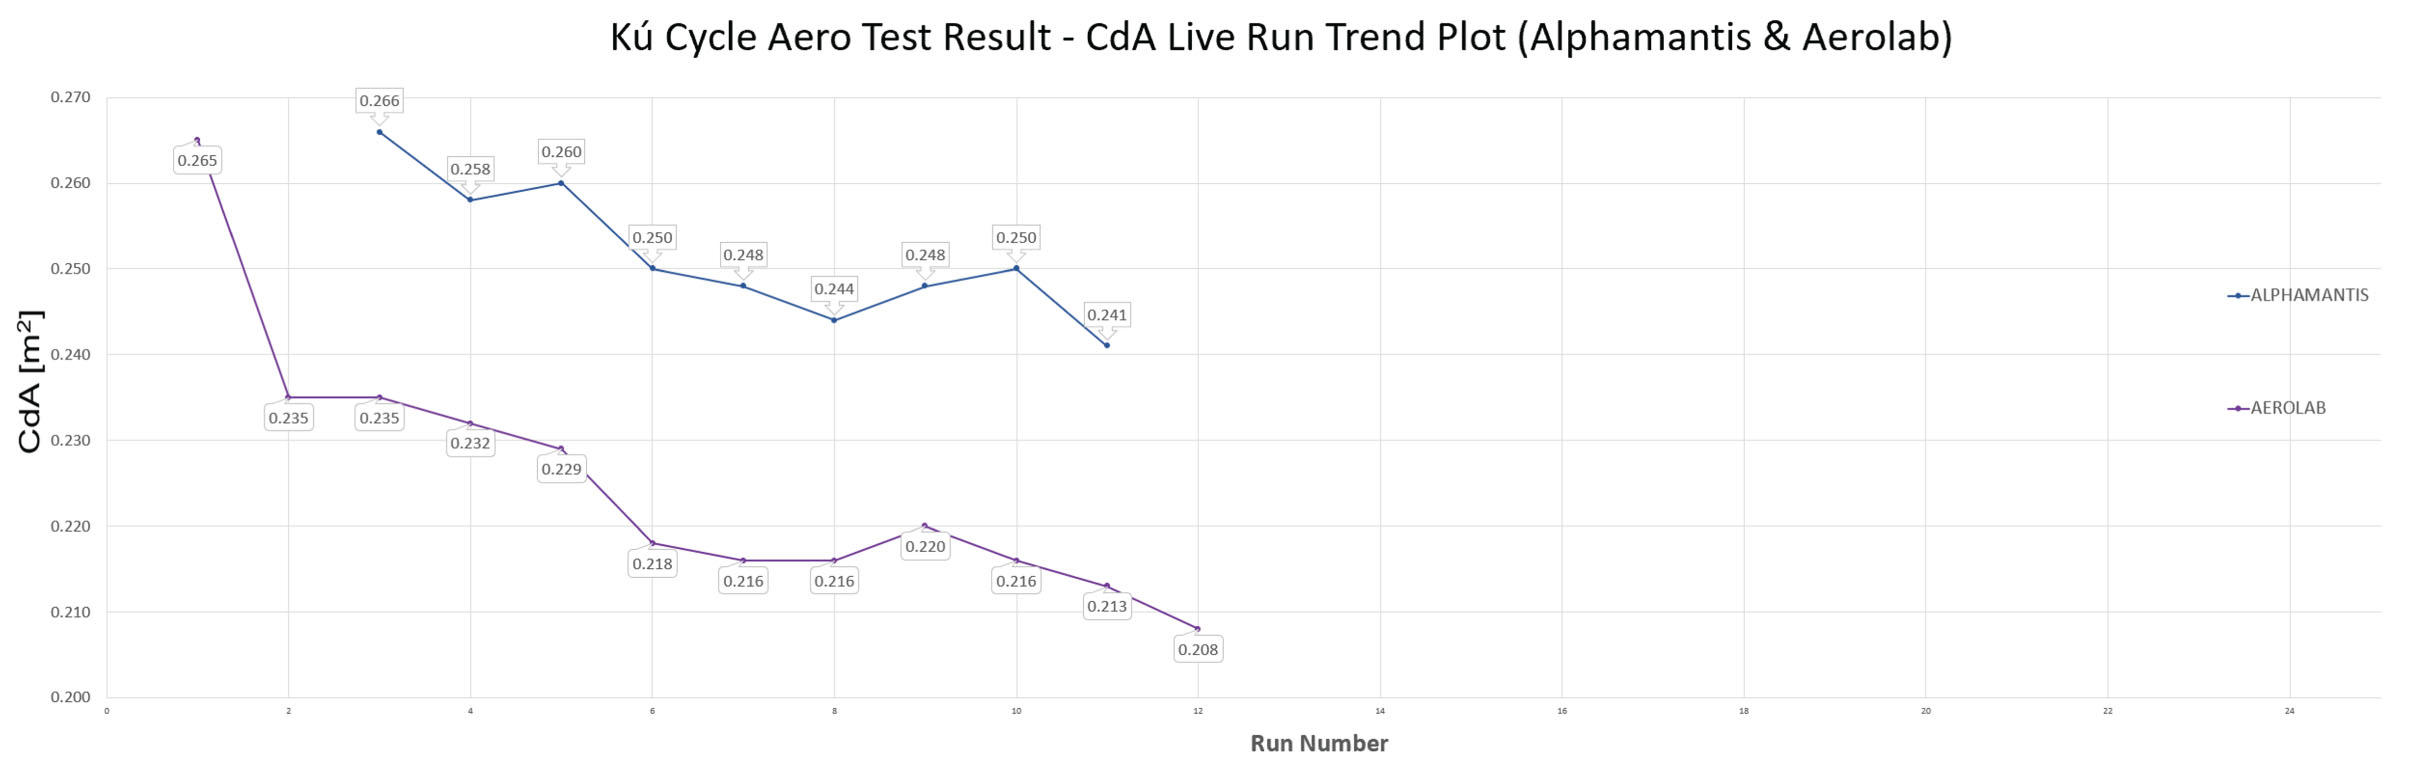
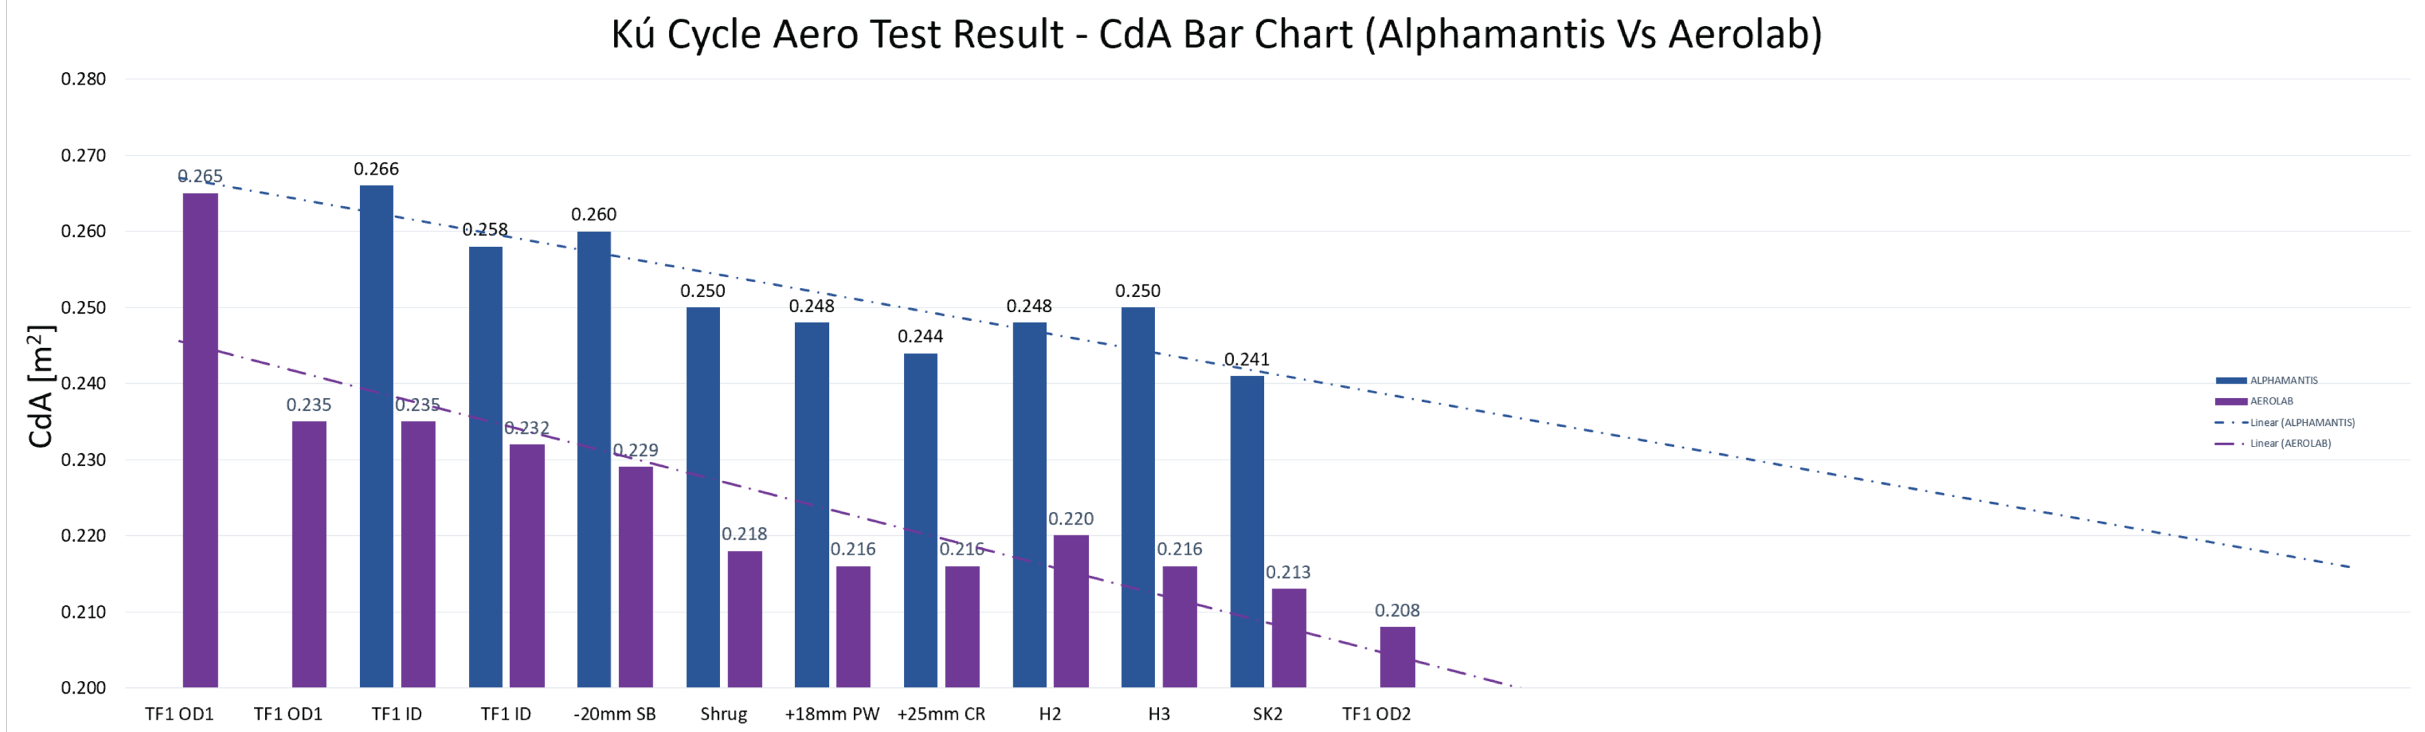
When testing indoors we utilise both the Alphamantis track system and the Aerolab device.
This indicates how different CdA’s can be recorded when one system takes into account different environmental conditions. In this case the Aerolab measures wind yaw.
Even inside where conditions are controlled, and generally stable, air conditioning, open doors and riders circulating on the track can actually mean the velodrome is quite windy!
However we can see from the way the CdA values track that the effect of changes to position or equipment are largely measurable using either system.
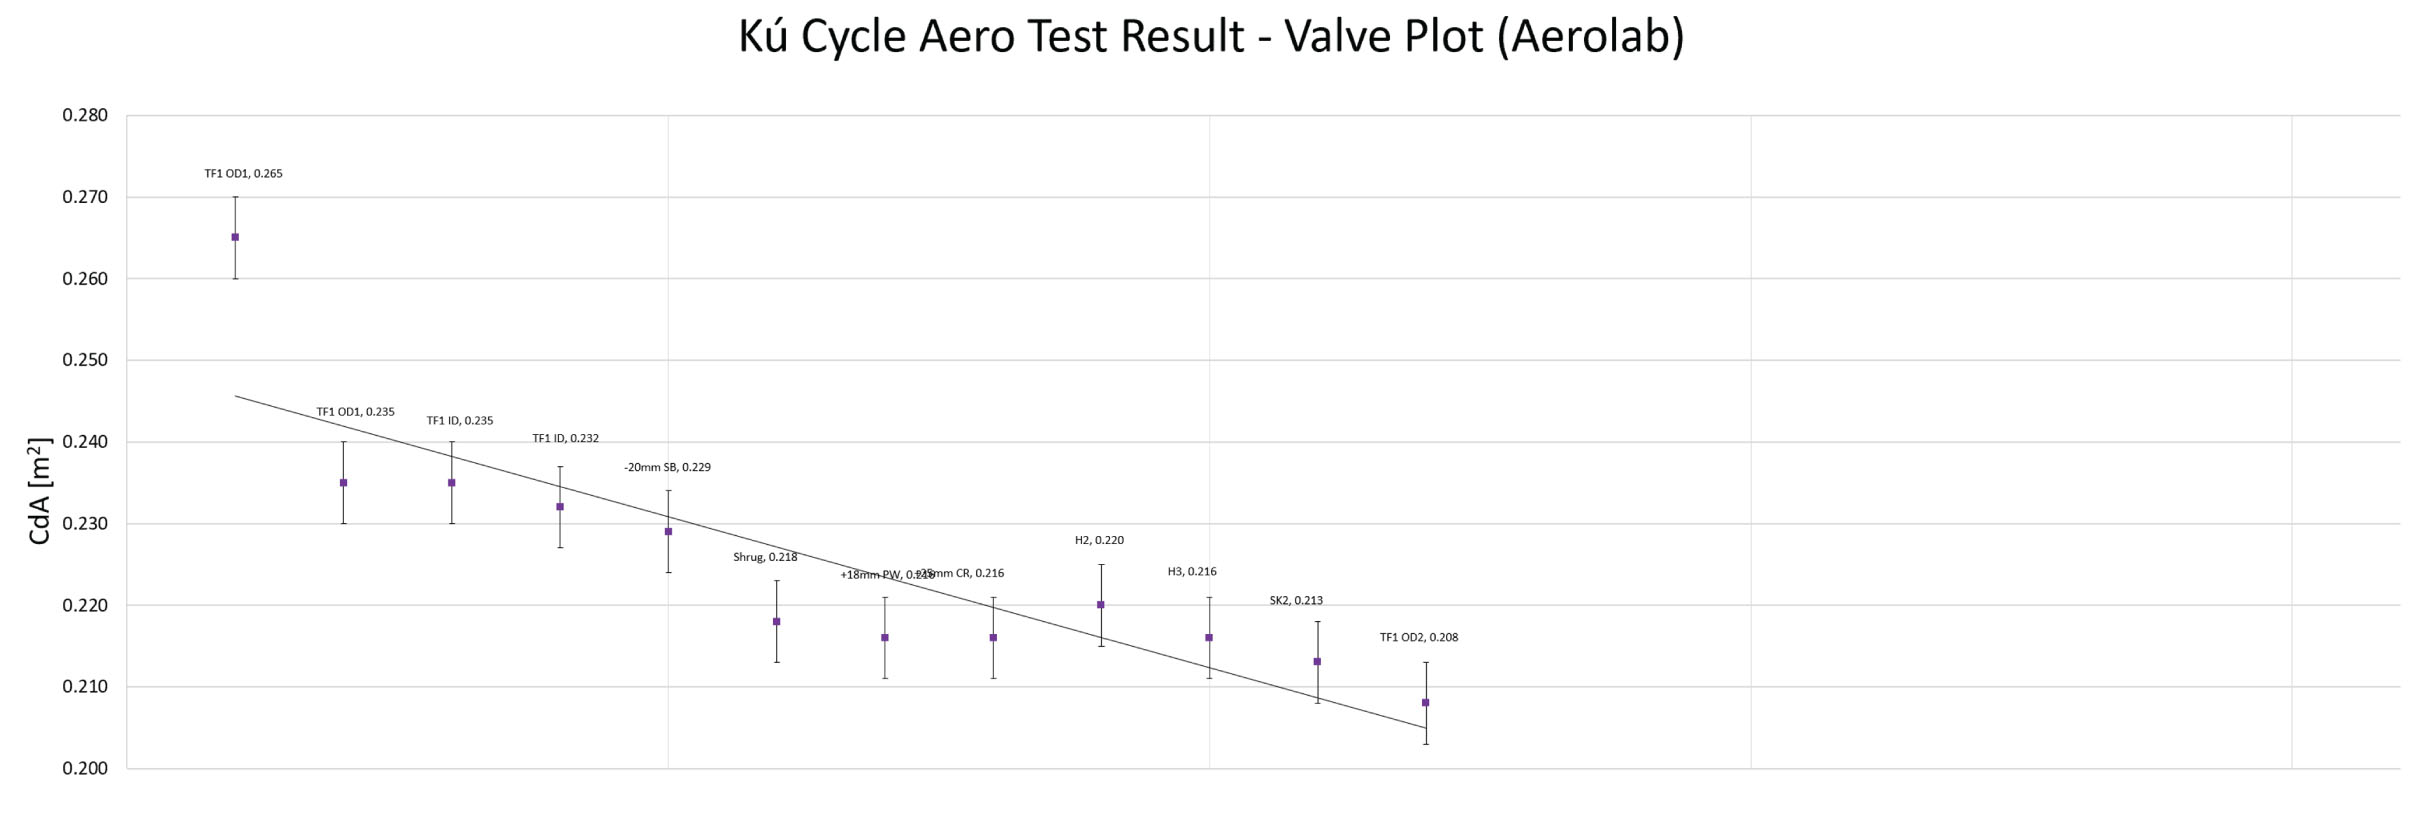
TEST PLOTS With so much data at our fingertips we can build a graphical picture of the test and where the performance gains have been found.
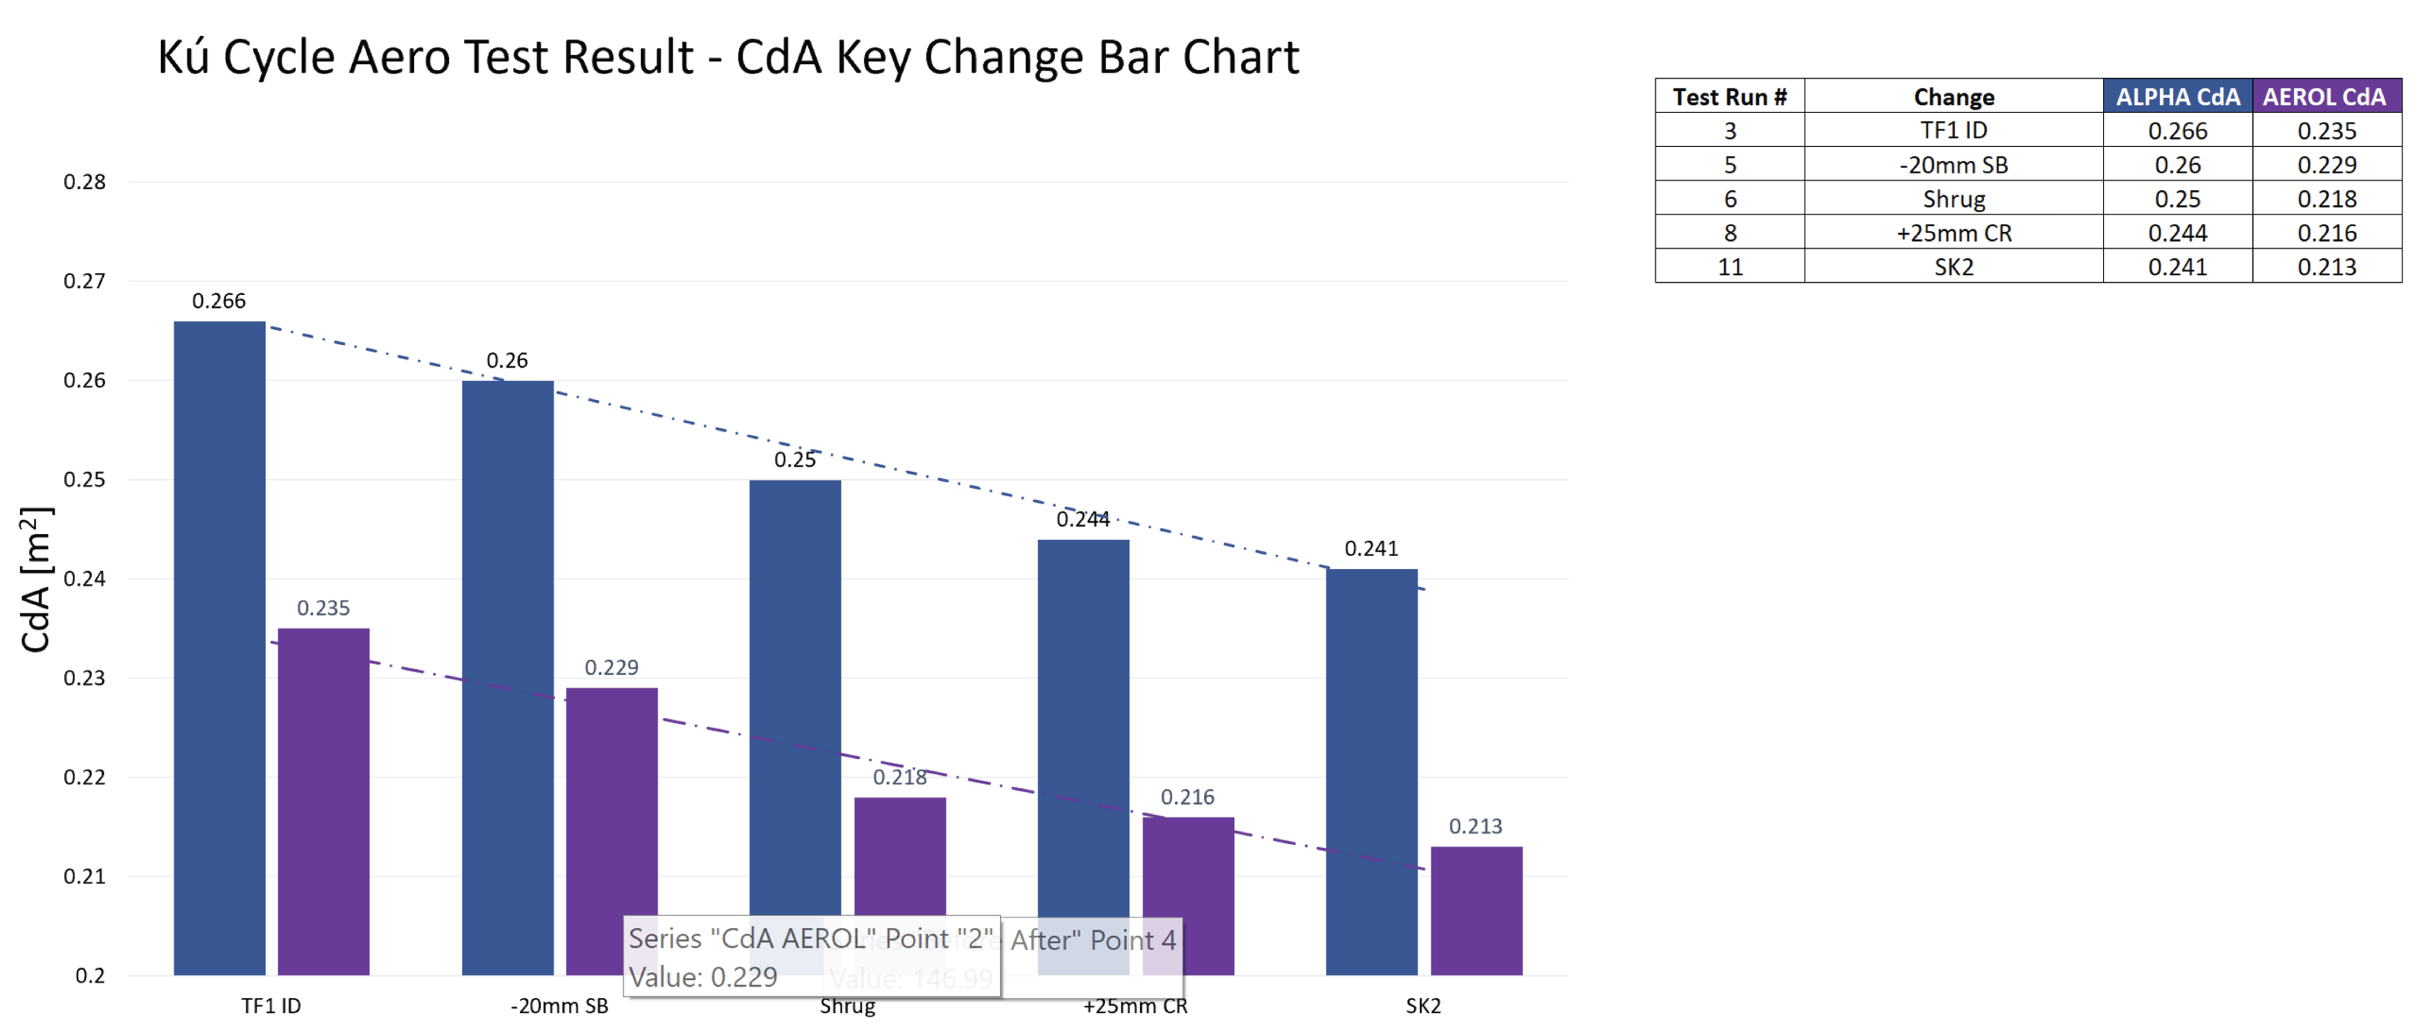
SWEET SPOT Not every change can be successful but a descending trend line keeps the test on track. We can see what works and what doesn’t.Not all changes work positively with others, by looking at the key changes in isolation we can finding that ‘sweet’ spot where things come together.
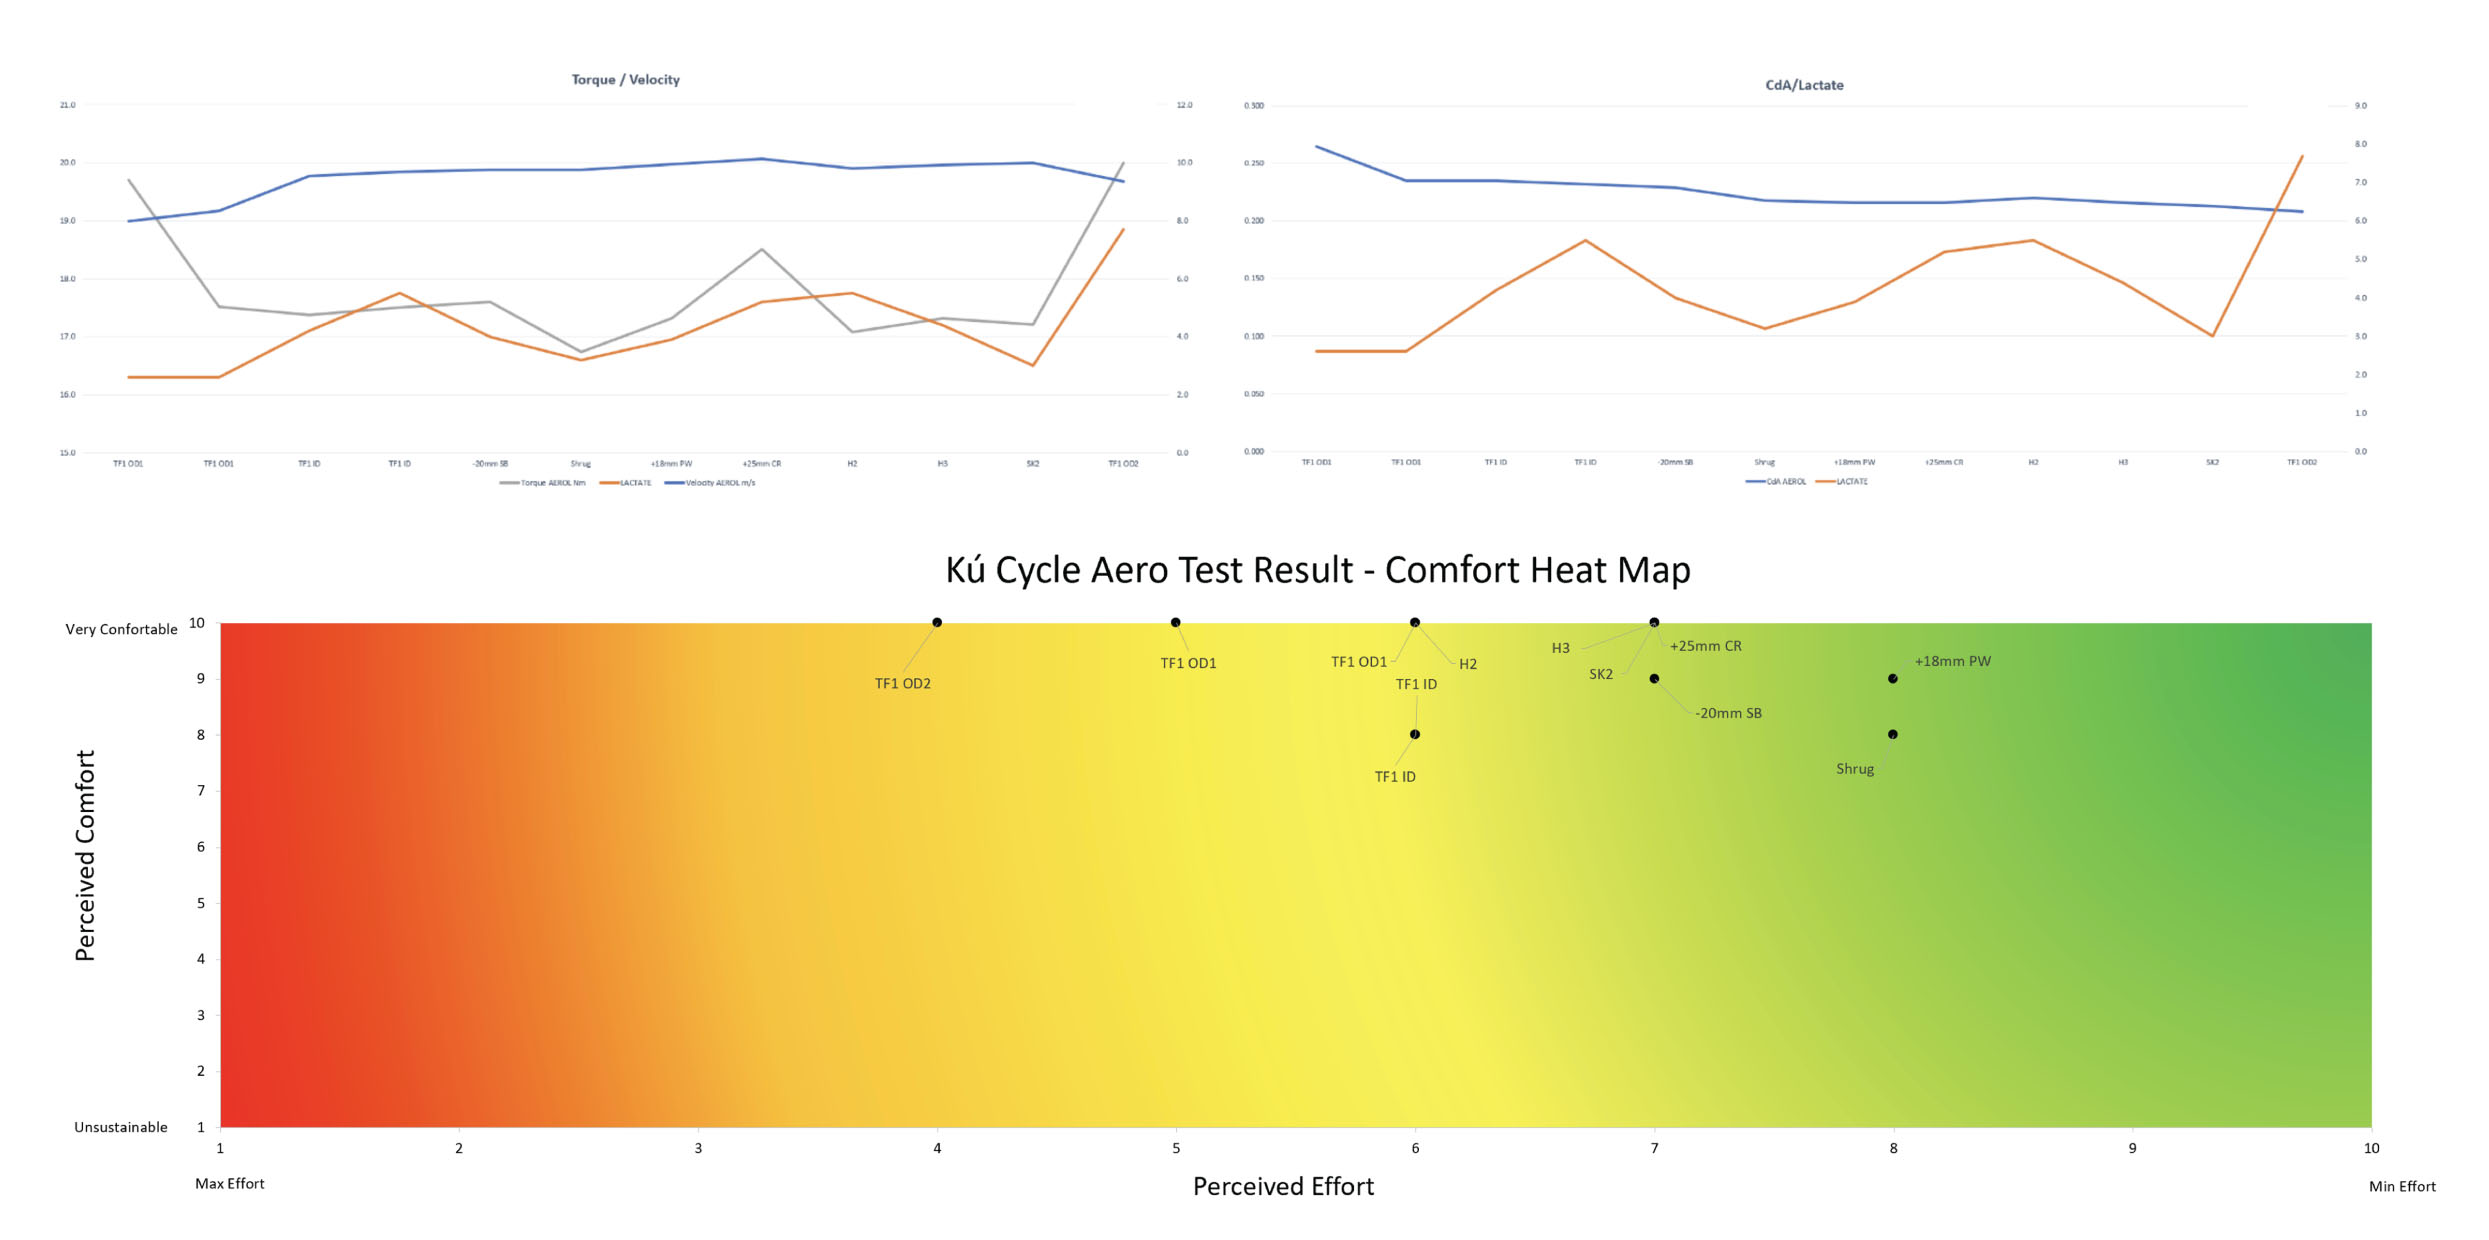
PHYSIOLOGICAL DATA Our complete test data set includes physiological markers of the rider in order to understand the sustainability of any performance improvement.
LACTATE BIOMAKER The rider’s lactate biomarker data is recorded immediately after each run. Considering these vales in parallel to power, torque (cadence) and CdA we can see if a particular change would likely be physically sustainable for the duration of the bike leg. Adding the riders perception of comfort and effort gives the final, complete, picture of the
CONCLUSIONS
Reducing CdA
While reducing CdA is the key performance driver, the target of the testing being to reduce the aerodynamic drag of the rider and bike, the absolute numbers do not mean much out of context of the test conditions.
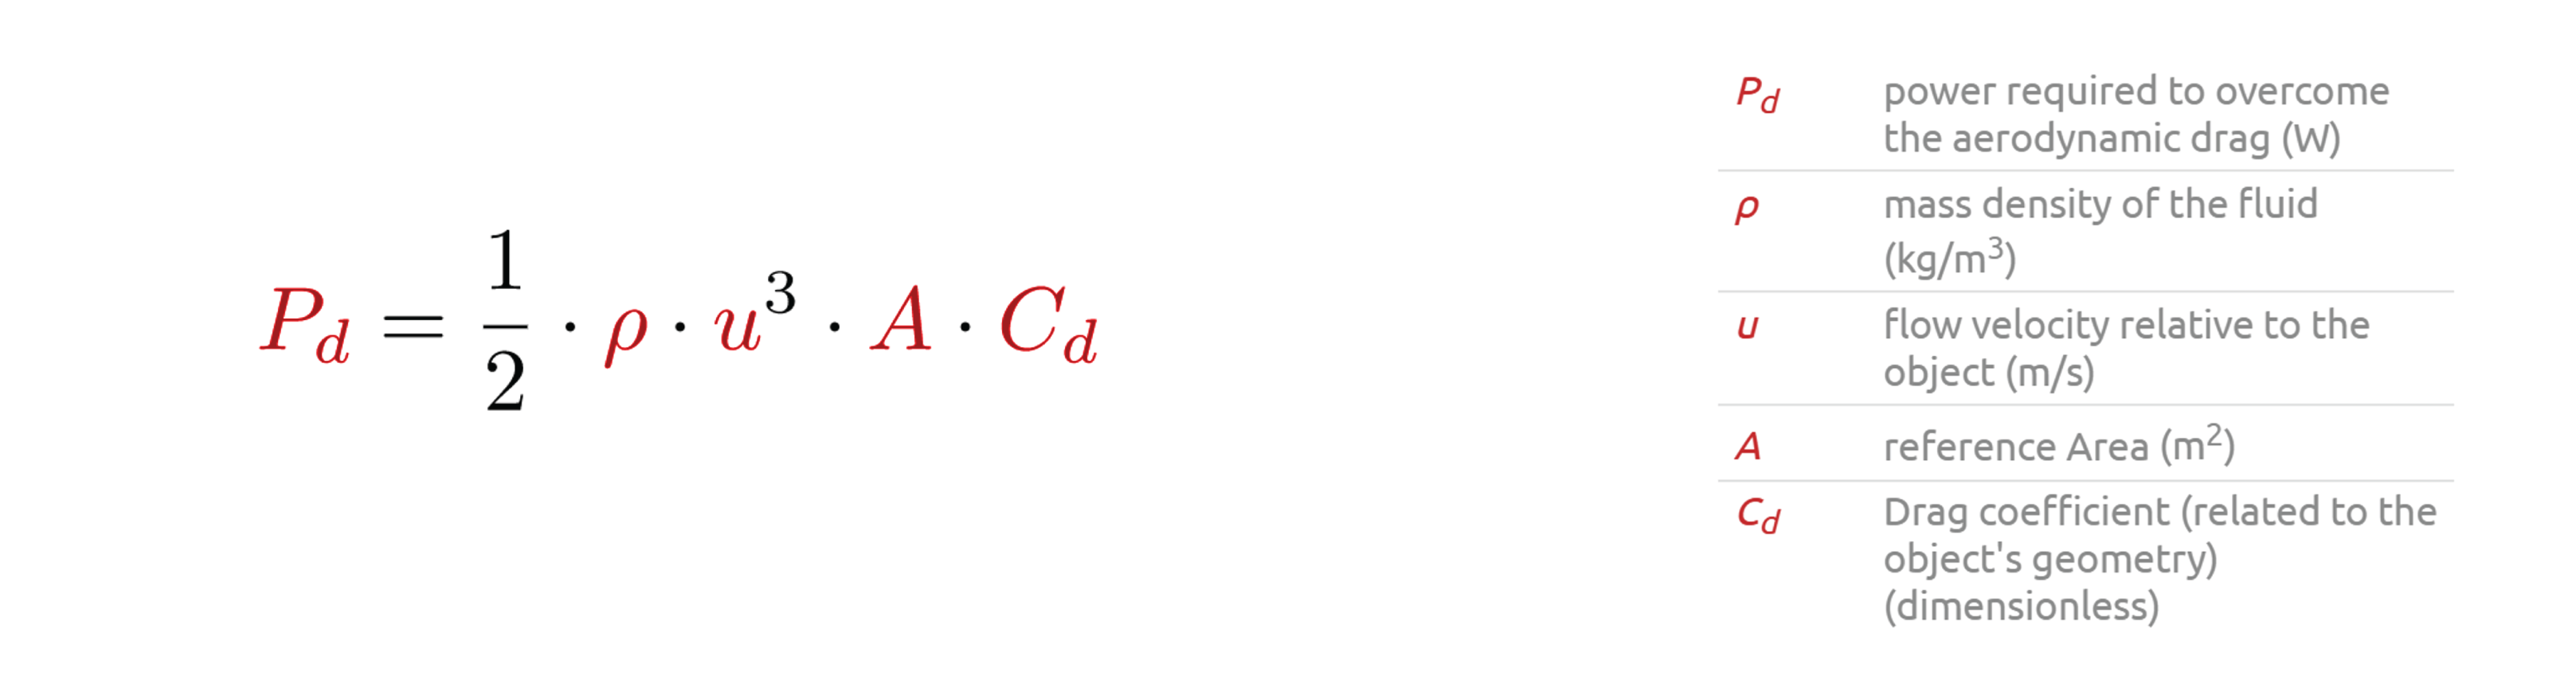
The intimate relation ship between CdA, Power and speed is captured in the power formula.
What is of more interest and makes the result more easily accessible is to use this
relationship to convert reduction in aerodynamic drag, CdA, into more practical ‘race related’ terms e.g:
1. Power saved riding at the same speed
2. Speed gained riding at the same power
3. Time saved over a typical Ironman or 70.3 bike leg.
GRAPHICAL PRESENTATION CdA key Change Bar, Watts gained, Average Speed Gained, Time Saved.
FINAL TEST SUMMARY
Measurable gains
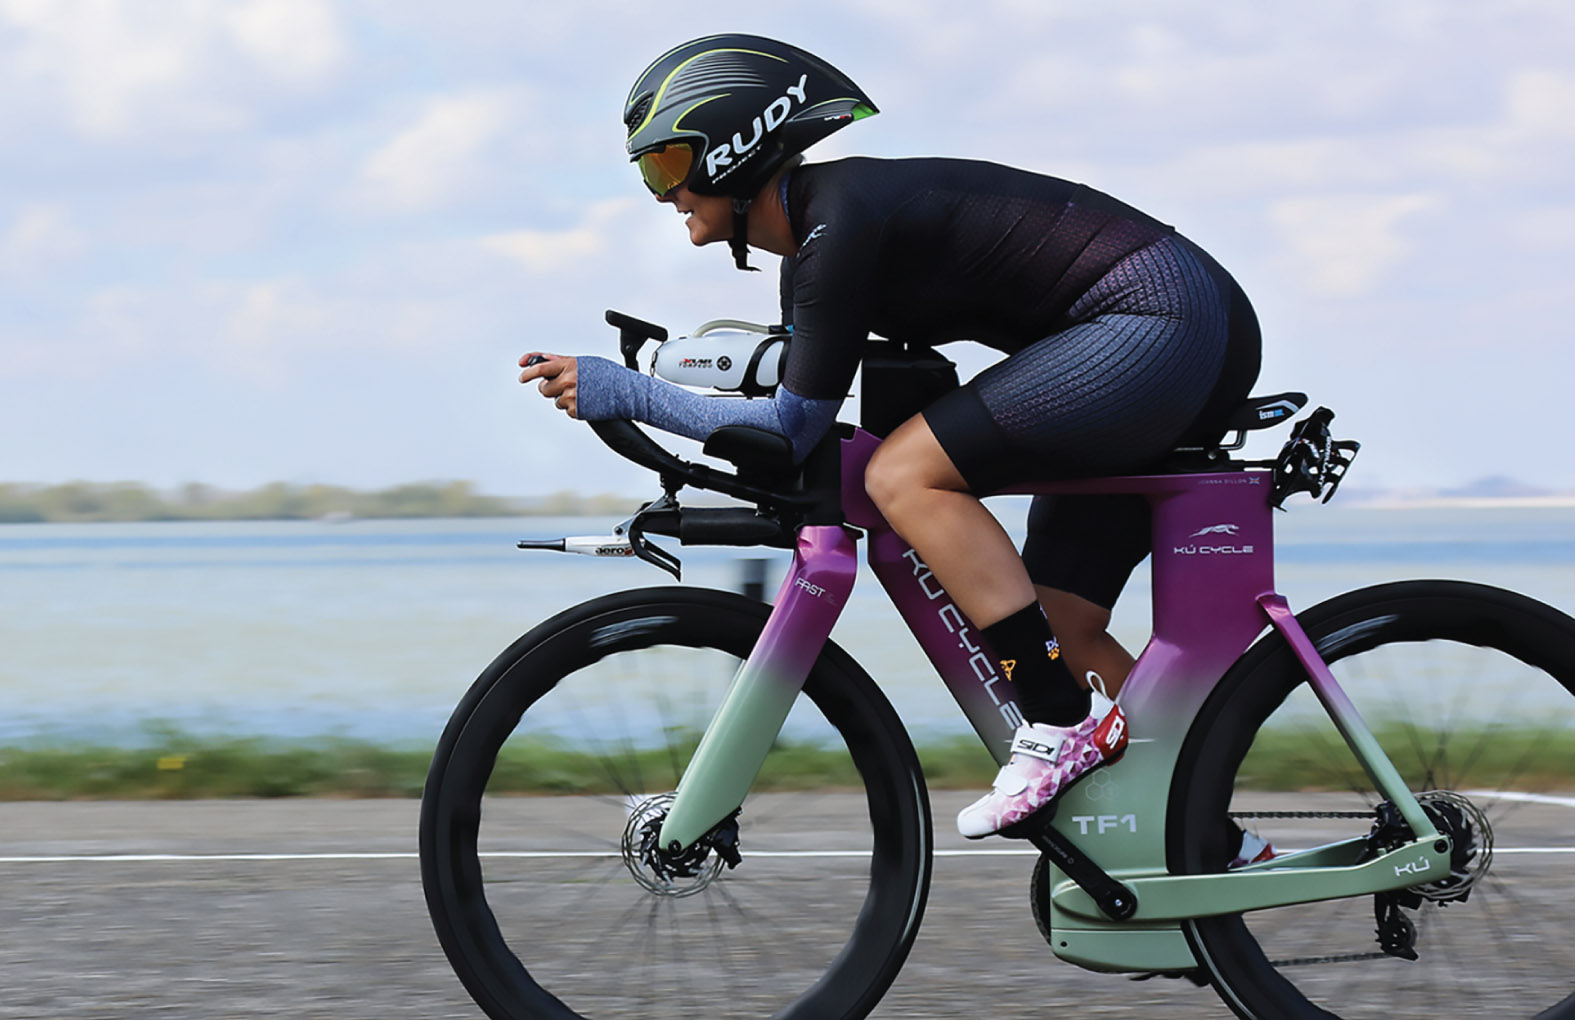
Joanna came to the aerotest immediately after her first race on the TF1. Prior to this Joanna had been recuperating from a bad accident for over 9 months. Joanna carried some physiological side effects affecting her position that needed accommodating during the tuning process.
Joanna’s outdoor best CdA of 0.235 from the first day outside was repeated in her first run in the velodrome. Indicating the dominance of her initial position on her CdA.
Over the course of tuning Joanna on her TF1 in the velodrome the various changes produced a difference between highest CdA of 0.235 and a lowest CdA of 0.213
This is a difference of 9.4%, and would equate to Joanna saving 7.6 Watts over a full Ironman ridden at 30km/hr, or a time gain over the same distance of 10 minutes, if she rode at a constant normalised power of 150 Watts.
Joanna was not tested on her current bike, this means the full scale of any performance improvement switching to the TF1 cannot be known.
Joanna’s main gains came from increasing her saddle set back, moving the saddle rearwards by 20mm. Stretching her out by increasing the extension reach by 25mm to make her back flatter. Widening her pads by 18mm further improved her ability to shrug and lower her head.
Joannas new position, with shrug, combined with a better helmet, the Kask Mistral and her Zoot Team skin suit gave her best CdA of 0.213.
We use cookies to personalise content and ads, to provide social media features and to analyse our traffic...
We also share information about your use of our site with our social media, advertising and analytics partners who may combine it with other information that you’ve provided to them or that they’ve collected from your use of their services. Cookie PolicyRead MoreCookie Policy